June 28, 2012

Nifty Update - 28th June 2012


Nifty Future daily chart above

Another day with bit of up movement but getting stuck around resistance levels.

Keep eye on upside, long above 5205 levels

June 27, 2012

Nifty Update - 27th June 2012


Nifty future daily chart above

Nifty hasn't done anything from past 5 days. We are trading in same range of 5090 - 5205

Keep both levels in mind to trade either side of it.

May be it is time to be stock specific. Thermax gave a decent returns in last one month and it is going to catch eyes of chart readers.

June 25, 2012

Nifty Update - 25th June 2012


Nifty Future weekly chart above

we had a hammer like formation on upmove on weekly candlestick chart. Nifty is facing resistance arnd 5205 levels.


Nifty future daily char above

No change from friday analysis. trade cautionly. Long above 5205 on closing basis only and shorts below 5080 levels.

Else it is time to be stock specific

June 22, 2012

Aban Offshore - Update


Aban Offshore - Earlier post is here

It is not able to cross the immediate downward slopping trendline and also closed below the lower upward trendline.

Stock never went above 360, so buy was never trigger.

Nifty Update - 22nd June 2012


Nifty Future daily chart shown above

As we can see, with the yesterday move we are very close to the upper trendline. We closed above 200EMA and below upper trendline.

If market is not able to cross 5180 / 5205, one can go short for target of 5080 around. 

June 21, 2012

Nifty Update - 21st June 2012


Nifty Future weekly chart shown above

Nifty hasn't moved across the trendline. It is trading at present two trendlines. Immediate Support 5085


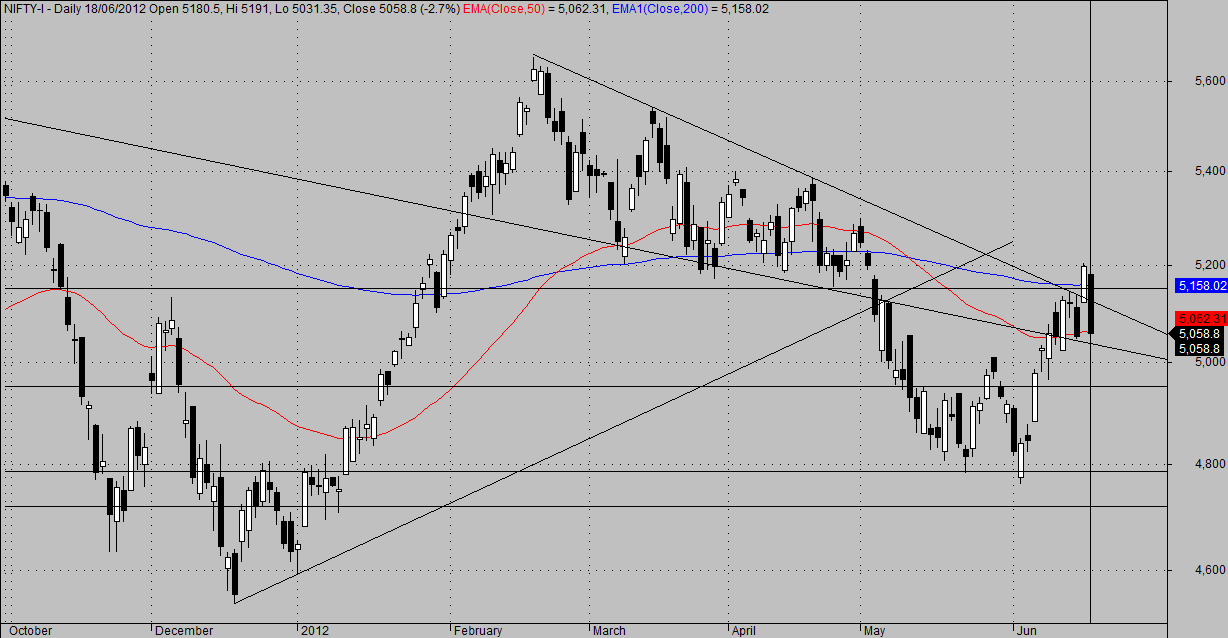
Nifty future daily chart shown above

We are seeing the same thing on daily charts too, Nifty sandwitched btw same trendlines. On daily charts, nifty is at upper bollinger band.

Risk lovers can short market on break of 5080 on nifty future levels for targets of 5020.
Other can short on break of 5020 only.

Long side trade only above 5205

Trade cautionly.

June 20, 2012

Nifty Update - 20th Jun 12


The chart says that the nifty is facing resistance on the weekly chart. So, it is advisable to sit at the side lines for Nifty take a clear side and post that take some trading position based on the nifty movement. Globally things have improved marginally.

June 19, 2012

Aban Offshore - Buy


Aban Offshore (Face value - 2/-, dividend - 180%)

Daily spot chart shown above.
It is still moving in a big downward channel from feb'12 onwards. from June'12 it is trying to try for the breakout.

One can buy this stock as on weekly charts it seems to found support around double bottom level of 320

Buy above 360 for target of 378 - 380 with stop loss of 354

Nifty Update - 19th June 2012


Nifty future daily chart above

We almost bounced back from 200EMA with one day close above 200EMA

Nifty took support from lower trendline.Trade according levels.

Short below 5020 and long above 5205 (last swing high)

June 18, 2012

Nifty Update - 18th June 2012


If Greece decided to stick with Euro Zone look for 5171 as the first resistance. Else, god save the people holding speculative and leverages buy positions.

Today will be one of the biggest decisions of history will be made with either Greece sticking to the Euro Zone or leaving it. If they decide to remain with Euro it will be big boost for the world financial market. But the bigger question is will the Euro zone able to bail out all the struggling economies like Spain, Italy, Neatherland and other. How will they be able to garner such kind of resources to finance the bailout? Why USD is valued so high when they are running one of the biggest current account deficit, unsustainable levels of debt? Why the world economies are eager to supply goods for free to US when they know ultimately some one has to pay the bill and US cannot just keep on printing $'s to push their own economy leading to doom to the economies world over.

Probably I am not the best person to answer this and RTI Act 2005 does not empower me to get such answers. :)

June 15, 2012

Nifty Update - 15th June 2012


Nifty Future daily Chart above

No trade open in nifty. Nifty tried to reach out to 200EMA but couldn't. Wait for the move across the levels sto open any new trade.
200EMA - above 5162 for positive side (long trade)
risk lovers - below 5020 for negative side trade (short trade)

Time to be stock specific or watching the market decide the trend.

June 14, 2012

Nifty Update - 14th June 2012


Nifty Future daily chart above

Profit booked yesterday at 5140 levels and not sitting on shores waiting for market to decide the trend.

We have hit the TL resistance and also are close to 200EMA (5162). Also other major events are very close.

Good time to be stock specific

June 13, 2012

Nifty Update - 13th June 2012


Nifty future daily chart above

It seems our anticipation of swing high place was early and wrong. We had market moved nicely up and a big up bar again

It seems market will try to reach out and trade above 200 EMA - 5162

Keep eye on this level for any trade. Time is to book profit of longs and be very stock specific or sit out. I am in the last option

June 12, 2012

Nifty Update - 12th June 2012


Nifty Future daily chart above

we had first downclose day after 3 days of upmove. Is 5124 our lastest swing high or this is just a temp pause, have to be seen.

Again good time to sit outside and let the market decide its next move and then trade. Or else be stock specific.

Levels to keep eye on  - above 5162 for long trades and below 5020 (for risk lovers) for short trades else 4940 for downmove.

June 11, 2012

Ranbaxy Ltd

Ranbaxy Ltd
Face value Rs 5 Dividend Nil


The stock is trading in the range of 475-530 for some time now. Currently it took the support at 480 levels and moving up. One can go long at around 478-480 levels and look for the price targets of 505 and 530.

Contribute generously for Akshaypatra. Donate (A small donation can make big difference)

Nifty Update - 11th June 2012


Nifty Future weekly chart above

We had  a big up bar on weekly charts with similar almost volumes on weekly bar. It seems market semay have some more levels on long side to move too.


Nifty future Daily above

Follow the trend and trend is up for the timebeing. Trade on positive side with stop loss of 5050 for target of 5150 - 5160. Also 50EMA is at 5050 and 200EMA is 5162 on daily charts

June 08, 2012

ICICI - Wait To trade


ICICI Bank (FV - 10/- Dividend -165% )

ICICI Spot daily chart above

Breakout happened, closed above 50 EMA but still is below the resistance / supply level of 843 - 845

Wait for it to close or trade above 845 to open a long trade and 820 to open a short trade

IDBI - Short


IDBI daily spot chart

IDBI faces resistance at 91 levels.

Risk lovers can look to short IDBI for target of 86 with stop loss of 91

Nifty Update - 8th June 2012


Nifty Future Daily chart above

Is today the time to book profits in long trade and open a new short trade

Nifty is going to see resistance around 5050 - 5070 area. Traders are recommended to book profits around those area.

Fresh short positions can be opened only on break of 4980

June 07, 2012

Nifty Update - 7th June 2012


Nifty Future Daily Chart

Nifty blasted up after crossing 4920 levels.

As mentioned in earlier posts above 4920, we should long nifty. Target of long trade 5050 - 5060 with stop loss of 4920

June 05, 2012

Nifty Update - 5th June 2012


Nifty Future Daily chart

It is so important to track and place your order if you ahve a trade open. I had one placed and it got executed and I enjoyed the counter rally that we saw yesterday in markets.

Even when world economy is not clear and Greece is having elections, our market is showing resilience to respect the support levels.

It seems for the time being market has found support arnd 4780 levels.

Trade on positive side only above 4920 .. till then sit on sidelines and enjoy the ride

June 04, 2012

Nifty Update - 4th June 2012


Nifty Future daily timescale charts shown above

Last friday we had a big black candle. It seems the trend has turned negative for the time being and keeping in mind the momentum of down move we saw on friday, we may see hitting 4782 on nifty future. We were short on break of 4920 level.

Just for reference attaching the midcap cash weekly charts too

It is at a very crucial support levels. Break down of these levels could sould alarm bells for midcap segment

Caution trade on short side recommended for booking around 4780 levels with stop loss of 4920

June 01, 2012

SAIL

SAIL
Face value Rs 10 Dividend 20%


As I mentioned earlier the Q4'11 numbers of the company were good and now the markets also giving them some respect. So, just after a day or over reaction the stock price is back. One can make handsome gains at the counter only if they have a long-term view of 1-2 years. However, this stock is positive on the weekly charts as well and in short-term likely to re-test the 100 mark.

I do own some shares at the counter but that only shows my believe on the scrip.


NIIT TECH Ltd

NIIT TECH LTD
Face value Rs 10 Dividend 80%


As expected earlier I did not find any thing bad with the results of the company. My finding were affirmed by the markets as the stock bounced backed to the 260 levels post some initial reaction. The stock since then is consistently moving up with breaking all the resistance and consolidating around 290 levels for couple of days. The notable thing is that the stocks performance has been very strong considering the sub dud environment in the markets. Now, if the stock is able to close above 326.5 which is also its all time high (I believe that stock will easily be able to break that), it will test the levels of 378. The above posted chart is a weekly chart.

Hopefully people hop on to the ride and enjoy the upmove.
Disclaimer: I am holding some shares of the company. 

Nifty Update - 1st June 2012


Nifty - Future daily chart above

Wait for clear direction to trade. Our market is trying to resist the latest downmove that all global markets are witnessing

support 4880
Resistance 4920