Showing posts with label FUNTA. Show all posts

December 02, 2015

TATA Chem 02-12-2015 Too early to predict a breakout?


TATA Chemicals have a multi-year high trend line of 438.5rs, this level was broken last year and stock formed a multi year high of 526rs but could not hold the level and retraced to 364rs. Only to recover quickly and now again the stock is trying to re-test its previous multi-year high level.

Can it break the level, if yes can it test the all time high of Rs 526 and surpass that. Only time will tell all the answers. I am positive on stock and have some investment position.

Note: The above is not a research report but information as available on public domain and it should not be treated as a research report. Any information discussed on the blog is for information purpose only. People are themselves responsible for any profit/loss arising on trading in the stock market.

Registration status with SEBI: I am not registered with SEBI under the (Research Analyst) regulations 2014 and as per clarifications provided by SEBI: “Any person who makes recommendation or offers an opinion concerning securities or public offers only through public media is not required to obtain registration as research analyst under RA Regulations”

Disclosure: It is safe to assume that I have the stock in my portfolio/trading position and hence my point of view will be biased. Readers should consult their financial advisory before any investments.

Warning: Stock trading is high risk activity and can lead to loss of up to 100% of invested capital.

BPCL BO on Weekly and daily charts 02-12-2015


BPCL has given BO on both Daily and Weekly Charts, represented by Blue and Yellow lines respectively.

I expect the stock to test the previous highs.

Note: The above is not a research report but information as available on public domain and it should not be treated as a research report.

Registration status with SEBI: I am not registered with SEBI under the (Research Analyst) regulations 2014 and as per clarifications provided by SEBI: “Any person who makes recommendation or offers an opinion concerning securities or public offers only through public media is not required to obtain registration as research analyst under RA Regulations”


Disclosure: It is safe to assume that I have the stock in my portfolio/trading position and hence my point of view will be biased. Readers should consult their financial advisory before any investments.

Warning: Stock trading is high risk activity and can lead to loss of up to 100% of invested capital.

February 13, 2014

Caplin Point: Result update Q2 2013-14


Results taken from BSE India.com

Result highlights:
1. Revenue increased by 39% yoy and 27% qoq
2. Net profit more than doubled to 8cr leading to eps of more than Rs 5 per share the qtr making it almost 8 rs for the six months period this was 9.5rs for full last year..
3. Cost of material consumed has reduced from 8.16cr to 5.41cr. I am not sure how this is possible unless they are more in trading now rather than actually producing goods. This is validated by increase in purchase of stock in trade from 13.1cr to 18.7cr
4. Employee benefit expenses have increased almost 80% yoy. This might be due to new plants starting production.

My take on the results:
On face value things look awesome and going by Indian standards of disclosures and working of management nothing to worry about, infact it is time to sit back and enjoy the benefits of investment made in the stock.

Disclaimer: I own 1250 shares (previously 1500) sold 250 shares recently to recover my entire cost of investment plus took some profits off the table


February 06, 2014

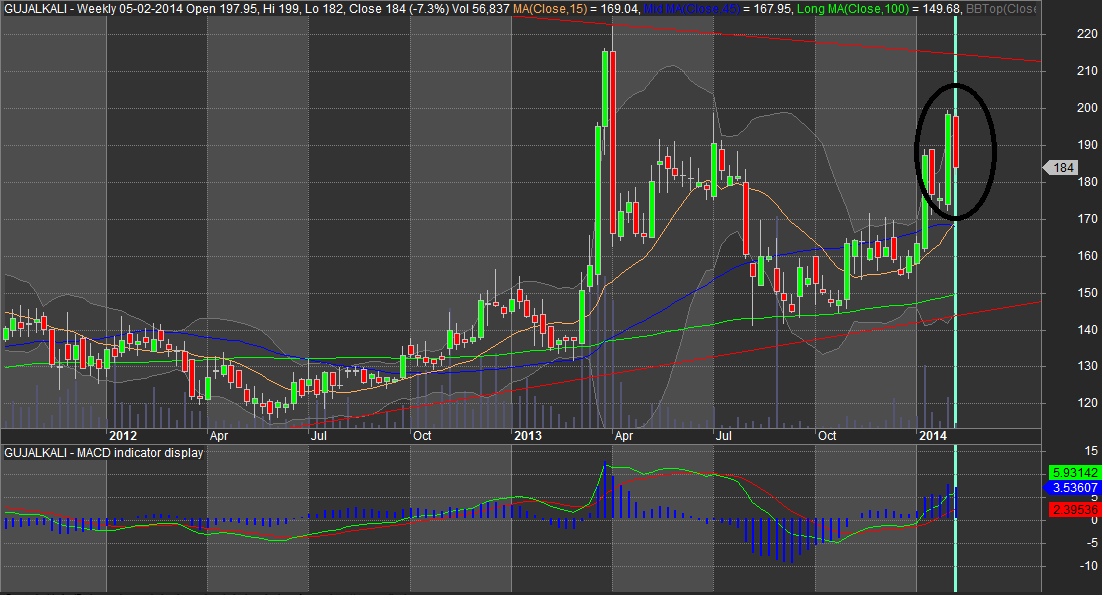
Gujarat Alkaline and Chemicals Ltd: Followup


As expected the results did not justify the price movement. We all saw that market is trying to be stable to positive in last two days but this stock in particular is on a falling spree. you cannot see the daily falls as this is a weekly chart. The point over here is invest based on logic not by just following some one blindly.

Happy investing :)

January 31, 2014

Gujarat Alkaline Ltd: Result Update Q3 2013-14

* Results from BSEIndia.com

Revenues of the company have increased a good 21.54% but the increase in cost of power and fuel ensured that the rise in profits are not in line with the increase in sales. 

Readers will say cut the crap and tell me if I can buy at current levels or not ..

My answer to this question is: The recent price movement is not justified by the kind of results company has produced all its peers namely AB Chemicals, DCW etc are trading at 10-20% above the yearly lows where in this one is trading 10-12% below yearly highs. Having said that its good to stay with the leaders of the sector.

Money is yours so final decision rest with you.


Technically as well the stock is too far from my comfort level to invest in.

Happy investing

Disclaimer: Currently, I dont hold any shares in the company.. I sold my holding of 200 shares in July 2013

January 28, 2014

REC LTD


Charts were weak from 200 levels..

Now will be interesting to see if it can take support at 160 levels or test 140 ones

Happy investing

DCB Bank Follow up


As feared it could not hold support at the trend line..

Can this take support at 50 or 45 coming?

Happy investing

Disclaimer: Holding some shares at different rates

January 23, 2014

HDFC Bank: Saga of 30% plus growth is over and Indusind Bank is the new hero

Are the glory days over?

HDFC Bank presented the results few days ago with impressive growth of 25% (YoY) but this was second successive miss of 30%+ growth it was able to achieve for last 13 years in a row till the trend was broken in FY 2013-14 Q2 and Q3.

Interesting comparisons:


**Comparison charts are from Moneycontrol.com

If I compare this directly with Ramesh Sobti's headed Indusind bank. The valuation of later looks more interesting for the following reasons:

1. Ramesh Sobti has proven track record of growth and profitability (Company is growing @ 30%+ for last many years)

2. Indusind Bank being of smaller size will face less hurdles to sustain 30% kind of growth going ahead.

3. Since 2008 Indusind bank has given more than 1700% return compared to ~250% return by HDFC bank in the same duration

4. Even at current valuation Indusind is trading at lower valuation than HDFC Bank.

Should Indusind Bank replace HDFC Bank in your portfolio ?

Happy Investing

Disclaimer: I have no positions in either Indusind Bank or HDFC Bank

DCB Bank Ltd


The stock gave a sell signal when it was not able to sustain above 60.. but still traded above the trend line for couple of days..

Will this move against the trend of banks in general and dip south or will it test the 60's again..

Interesting to see.

Happy investing

Disclaimer: I hold some investment position in the stock @ various prices

January 09, 2014

REC Limited


The stock is current taking support at monthly trend line as highlighted in red above.


Daily charts are showing encouraging signs but at the long term support level

Will it bounce back for the tgts of 230 or will it test 180 levels... interesting to see

Happy investing

Disclaimer: Personally don't have any open position in RECLTD


January 08, 2014

DCB interesting stock

I will post three charts of DCB for 3 days, tell me your opinion on the way going forward:


Chart of 2nd Jan 2014


3rd Jan 14 stock took support at long term trend line in red and 6th Jan 14 it continued to trade above the weekly trend line.


7th Jan 14 took support @ weekly trend line and continue to trade above it.

Will it continue to take support @ weekly trend line or test the monthly trend line again..

This will be interesting to watch..

Happy investing :)

Disclaimer: I own shares in the company and continue to hold them as of date

Caplin Point Update


Caplin Point almost reached the tgts of Rs 125

Book 50% of your holding and hold rest for the next to come.

Happy investing :)

Older post: Click Here

October 23, 2012

Suven Life Science

Suven Life Science

 
First Tgt of Rs 29 achived yesterday. Previous Update
 
Higher targets awaited.

October 22, 2012

Godrej Industries - Investment Idea

Godrej Industries Ltd

NSE: GODREJIND BSE: 500164

DVD: 175% Face Value: Rs 1 


Investment call: Look for the tgts of Rs 363-400 SL below 260 and buy around 235 levels. This is core portfolio investment stock in to FMCG, Real Estate (Through major shareholding in Godrej Properties).

 Disclosure: I hold 100 shares @ 235 since 2010

October 19, 2012

Suven Life Science

Suven Pharmaceuticals Limited was promoted in 1989 by Mr.Jasti Venkateswarlu and Mrs. Jasti Sudha Rani for the manufacture of bulk drugs and drug intermediates. The Company was incorporated as a Private Limited Company on 9th March, 1989 in the state of Andhra Pradesh. Subsequently on 4th January, 1995 it was converted into a Public Limited Company. The company has 2 manufacturing units and 2 R&D units in AP.
The company operates in three business segments:
a) Manufacturing (CRAMS)

b) Services (DDDSS)

c) Research and Development
Financials
Annual results:
(in Cr.)
2011 - 12
2010 - 11
2009 - 10
2008 - 09
2007 - 08
Income Statement
Revenue
203.83
150.43
129.31
140.83
119.95
Other Income
1.91
1.26
0.49
5.29
3.08
Total Income
205.74
151.69
129.81
146.12
123.04
Expenditure
-180.53
-137.67
-116.75
-130.46
-107.85
Interest
-9
-5.32
-4.05
-5.62
-4.57
PBDT
16.21
8.7
9
10.04
10.62
Depreciation
-5.54
-5.45
-5.29
-4.97
-4.36
PBT
10.67
3.25
3.71
5.07
6.26
Tax
4.85
7.15
3.3
1.99
1.99
Net Profit
15.52
10.4
7
7.06
8.26
Equity
11.67
11.67
11.59
11.59
11.57
Reserves
--
--
--
--
--
EPS
1.33
0.89
0.6
0.61
0.71
CEPS
1.8
--
1.06
1.04
--
OPM %
12.37
9.32
10.09
11.12
12.66
NPM %
7.62
6.91
5.41
5.01
6.89
*BSEINDIA.COM
The sales of the company has increased CAGR of 16% and the profit in the same period is growing @ 30 CAGR. During the same duration the OPM has increased by 225bps and NPM has increased by 221bps.

Quarterly:
(in Cr.)
12-Jun
12-Mar
11-Dec
11-Sep
11-Jun
Mar-12 (Annual)
Income Statement
Revenue
70.53
62.51
48.64
48.04
44.63
203.83
Other Income
0.53
--
1.56
1.62
0.2
1.91
Total Income
71.05
62.51
50.2
49.67
44.84
205.74
Expenditure
-57.19
-49.49
-48.06
-45.66
-39.46
-180.53
Interest
-3.22
-2.63
-2.14
-1.93
-1.64
-9
PBDT
10.64
10.4
0
2.08
3.74
16.21
Depreciation
-1.83
-1.37
-1.38
-1.4
-1.39
-5.54
PBT
8.81
9.02
-1.38
0.68
2.35
10.67
Tax
-0.85
-0.72
2.68
1.88
1.01
4.85
Net Profit
7.96
8.31
1.29
2.56
3.36
15.52
Equity
11.67
11.67
11.67
11.67
11.67
11.67
EPS
0.68
0.71
0.11
0.22
0.29
1.33
CEPS
0.84
0.83
0.23
0.34
0.41
1.8
OPM %
19.65
20.83
4.39
8.34
12.04
12.37
NPM %
11.29
13.29
2.66
5.33
7.53
7.62
*BSEINDIA.COM

Sales of the company grew by 13% QoQ and 58% YoY. During the same duration the profits of the company fell by 4% QoQ but rose by phenomenal 137% YoY.
Investment rationale:
1.    The company is sharing is investor friendly as they are paying dividend consistently since 2008 and gave bonus (1:1) in 2007.
2.    Strong promoter holding: Promoters shareholding in the company is more than 63.44%
3.    Profit margins of the company are rising coupled with increasing sales leading to higher EPS.
4.    Merger of SUVEN NISHTAA PHARMA PVT LTD will lead to more cost synergies thus higher profitability.
Inherent risk (specific to the company):

1.      This a Hyderabad based company so irrespective of claims of good corporate governance one may never know when company go bad like Jupiter Bio and Satyam.

2.      Historically, the performance of the company has been highly fluctuating.

The stock is listed both at BSE:530239 NSE: SUVEN. The closing price of the stock was  Rs 26.8

Technically too this stock is looking attractive for targets of 29 and 33.


Disclaimer: I own 600 shares of the company @ 31 since 2010. My relatives hold undisclosed quantities of shares in the company.