Background:
GACL was promoted in March 1973 by the Government of Gujarat (GoG) through its industrial investment arm, Gujarat Industrial Investment Corporation Ltd. (GIIC). It is the largest player in the domestic caustic chlorine industry with integrated operations 429,000 metric tonne per annum (MTPA) of caustic soda at its plants in Vadodara and Dahej as at March 31, 2012 (making it the market leader in the caustic soda industry). Its major products include caustic soda, liquid and gaseous chlorine, hydrogen peroxide, etc which find application in a wide range of industries, including the manufacturing of textiles, pulp and paper, aluminium, detergents, soaps, rayon, plastics, pharmaceutical and agricultural chemicals, etc. GACL’s manufacturing plants are located at Nandesari in Vadodara and Dahej near Bharuch. The Dahej complex also houses a gas-based captive power plant of 90 MW. In addition, the company installed totaled wind power plant for 21 MW.
Financials
Annual results:
(in Cr.)
|
2011 - 12
|
2010 - 11
|
2009 - 10
|
2008 - 09
|
2007 - 08
|
Income Statement
|
Revenue
|
1,710.97
|
1,435.41
|
1,315.87
|
1,420.54
|
1,133.63
|
Other Income
|
11.77
|
11.28
|
24.04
|
9.53
|
69.75
|
Total Income
|
1,722.74
|
1,446.69
|
1,339.91
|
1,430.07
|
1,203.38
|
Expenditure
|
-1,339.84
|
-1,166.71
|
-1,054.61
|
-1,034.75
|
-803.58
|
Interest
|
-20.53
|
-19.89
|
-17.48
|
-24.59
|
-25.33
|
PBDT
|
362.37
|
260.09
|
267.82
|
370.73
|
374.47
|
Depreciation
|
-138.95
|
-132.97
|
-121.55
|
-109.43
|
-98.96
|
PBT
|
223.42
|
127.12
|
146.27
|
261.3
|
275.51
|
Tax
|
-69.81
|
-12.81
|
25.57
|
-69.03
|
-51.43
|
Net Profit
|
153.61
|
114.31
|
171.84
|
192.27
|
224.08
|
Equity
|
73.44
|
73.44
|
73.44
|
73.44
|
73.44
|
Reserves
|
1,534.35
|
1,406.33
|
1,317.64
|
1,171.49
|
1,004.99
|
EPS
|
20.92
|
15.56
|
23.4
|
26.18
|
30.51
|
CEPS
|
39.84
|
33.67
|
39.95
|
41.08
|
43.99
|
OPM %
|
22.38
|
19.51
|
21.68
|
27.83
|
35.27
|
NPM %
|
8.98
|
7.96
|
13.06
|
13.53
|
19.77
|
Quarterly:
(in Cr.)
|
30-Jun
|
31-Mar
|
31-Dec
|
30-Sep
|
30-Jun
|
Mar-12 (Annual)
|
Income Statement
|
Revenue
|
441.05
|
427.4
|
443.38
|
420.35
|
420.64
|
1,710.97
|
Other Income
|
0.94
|
1.66
|
0.95
|
8.04
|
0.32
|
11.77
|
Total Income
|
441.99
|
429.06
|
444.33
|
428.39
|
420.96
|
1,722.74
|
Expenditure
|
-323.4
|
-319.13
|
-367.35
|
-336.93
|
-318.09
|
-1,339.84
|
Interest
|
-2.96
|
-4.03
|
-4.91
|
-4.51
|
-5.53
|
-20.53
|
PBDT
|
115.63
|
105.9
|
72.07
|
86.95
|
97.34
|
362.37
|
Depreciation
|
-34.61
|
-34.7
|
-35.91
|
-35.23
|
-33
|
-138.95
|
PBT
|
81.02
|
71.2
|
36.16
|
51.72
|
64.34
|
223.42
|
Tax
|
-25.75
|
-26.99
|
-10.22
|
-14.66
|
-17.94
|
-69.81
|
Net Profit
|
55.27
|
44.21
|
25.94
|
37.06
|
46.4
|
153.61
|
Equity
|
73.44
|
73.44
|
73.44
|
73.44
|
73.44
|
73.44
|
EPS
|
7.53
|
6.02
|
3.53
|
5.05
|
6.32
|
20.92
|
CEPS
|
12.24
|
10.74
|
8.42
|
9.84
|
10.81
|
39.84
|
OPM %
|
26.89
|
25.72
|
17.36
|
21.76
|
24.46
|
22.38
|
NPM %
|
12.53
|
10.34
|
5.85
|
8.82
|
11.03
|
8.98
|
Balance Sheet
Balance Sheet
|
Mar '12
|
Mar '11
|
Mar '10
|
Mar '09
|
Mar '08
|
|
|
12 mths
|
12 mths
|
12 mths
|
12 mths
|
12 mths
|
|
|
|
|
|
|
Total Share Capital
|
73.44
|
73.44
|
73.44
|
73.44
|
73.44
|
Equity Share Capital
|
73.44
|
73.44
|
73.44
|
73.44
|
73.44
|
Share Application Money
|
0
|
0
|
0
|
0
|
0
|
Preference Share Capital
|
0
|
0
|
0
|
0
|
0
|
Reserves
|
1,534.35
|
1,406.34
|
1,317.64
|
1,171.49
|
1,004.99
|
Revaluation Reserves
|
0
|
0
|
0
|
0
|
0
|
Networth
|
1,607.79
|
1,479.78
|
1,391.08
|
1,244.93
|
1,078.43
|
Secured Loans
|
241.43
|
217.14
|
237.98
|
254.34
|
164.95
|
Unsecured Loans
|
70.01
|
165.13
|
85.26
|
80.89
|
150.52
|
Total Debt
|
311.44
|
382.27
|
323.24
|
335.23
|
315.47
|
Total Liabilities
|
1,919.23
|
1,862.05
|
1,714.32
|
1,580.16
|
1,393.90
|
|
Mar '12
|
Mar '11
|
Mar '10
|
Mar '09
|
Mar '08
|
|
|
|
|
|
|
Gross Block
|
3,161.25
|
2,769.24
|
2,686.47
|
2,480.91
|
2,217.72
|
Less: Accum. Depreciation
|
1,561.77
|
1,412.60
|
1,271.00
|
1,095.18
|
996.68
|
Net Block
|
1,599.48
|
1,356.64
|
1,415.47
|
1,385.73
|
1,221.04
|
Capital Work in Progress
|
43.26
|
293.46
|
176.05
|
101.29
|
42.76
|
Investments
|
161.08
|
156.2
|
140.51
|
117.28
|
120.51
|
Inventories
|
178.93
|
147.96
|
140.25
|
170.57
|
104.72
|
Sundry Debtors
|
250.44
|
279.85
|
263.55
|
248.1
|
193.91
|
Cash and Bank Balance
|
57.89
|
17.26
|
12.61
|
22.97
|
54.48
|
Total Current Assets
|
487.26
|
445.07
|
416.41
|
441.64
|
353.11
|
Loans and Advances
|
534.45
|
389.48
|
382.47
|
329.15
|
285.44
|
Fixed Deposits
|
0
|
0
|
0
|
0
|
0
|
Total CA, Loans & Advances
|
1,021.71
|
834.55
|
798.88
|
770.79
|
638.55
|
Deffered Credit
|
0
|
0
|
0
|
0
|
0
|
Current Liabilities
|
506.62
|
499.78
|
577.14
|
534.97
|
404.38
|
Provisions
|
399.7
|
279.02
|
256.9
|
296.85
|
263.94
|
Total CL & Provisions
|
906.32
|
778.8
|
834.04
|
831.82
|
668.32
|
Net Current Assets
|
115.39
|
55.75
|
-35.16
|
-61.03
|
-29.77
|
Miscellaneous Expenses
|
0
|
0
|
17.44
|
36.89
|
39.35
|
Total Assets
|
1,919.21
|
1,862.05
|
1,714.31
|
1,580.16
|
1,393.89
|
|
|
422
|
311.49
|
368.02
|
319.1
|
163.05
|
Book Value (Rs)
|
218.93
|
201.5
|
189.43
|
169.52
|
146.85
|
Investment rationale:
1. The debt of the company has been reducing consistently over the period of years.
2. Strong promoter holding: Promoters shareholding in the company is more than 36.72%
3. Book value of the shares is Rs 226.57 ie 58% less than the current market price.
4. Largest installed capacity of 429,000 MTPA highest in the industry and the company is working at 100% capacity compared to industry average of 70%
5. The total operating income of GACL increased by 19% in FY12 on account of higher prices, which was offset by decline in sales volumes by 12% for its major products.
6. Recent levy of anti-dumping duty on imports from Korea and other nations will help increase or at least stabilization of prices.
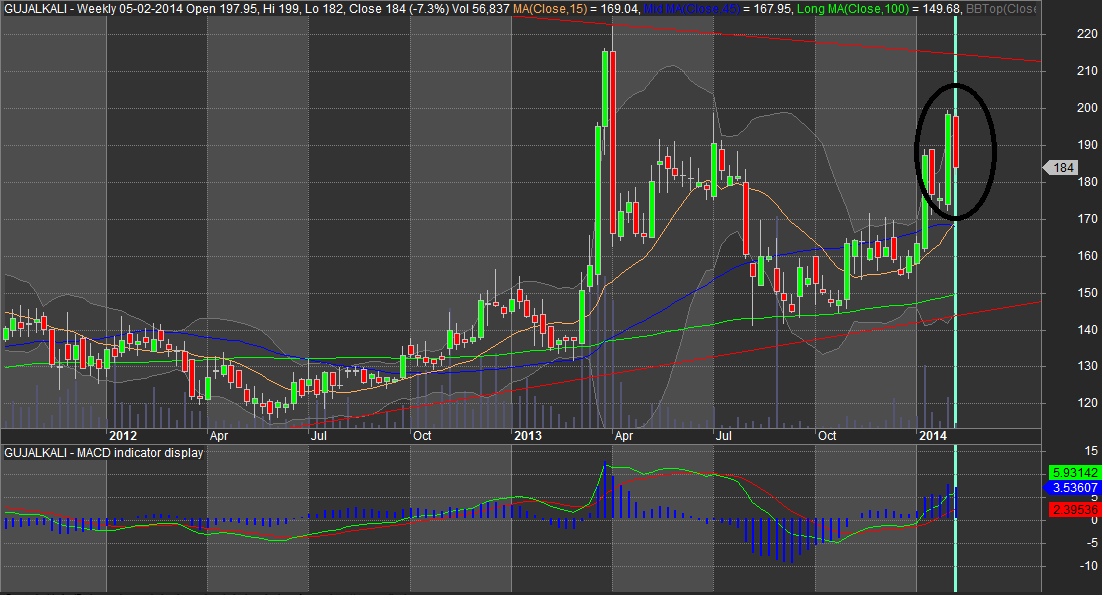
The stock is listed both at BSE:530001 NSE: GUJALKALI. The closing price of the stock was Rs 132.1
Dividend: 30%
Add this stock on declines or buy immediately if moves past Rs. 140
Disclaimer: Author and his immediate family owns 200 shares of the company @ 131.5 since October 2012.